Catering to Investors Through Security Design: Headline Rate and Complexity

Célérier, Claire, and Boris Vallée. “Catering to Investors Through Security Design: Headline Rate and Complexity.” The Quarterly Journal of Economics 132.3 (2017): 1469-1508.

Abstract

This study investigates how banks design financial products to cater to yield-seeking investors. We focus on a large market of investment products targeted exclusively at households: retail structured products. These products typically offer a high return under their best-case scenario –the headline rate– that is nested in a complex payoff formula.

Using a text analysis of the payoff formulas of the 55,000 products issued in Europe from 2002 to 2010, we measure product headline rates, complexity and risk. Over this period, product headline rates depart from the prevailing interest rates as the latter decrease, complexity increases, and risky products become more common.

In the cross section, the headline rate of a product is positively correlated with its level of complexity and risk. Higher headline rate, more complex, and riskier products, appear more profitable to the banks distributing them.

Our results suggest that financial complexity is a by-product of banks catering to yield-seeking investors.

On structured products

“in Europe, the creativity of the marketing brochures of these products is a key feature of the market”

“Financial institutions appear to rely frequently on analogies and powerful metaphors in the marketing material of retail structured products, to draw investor’s attention to the headline rate. (…) virtually all product names are related to one key metaphor stressed by Zaltman (1997): transformation, journey, balance, or resource.”

Measures

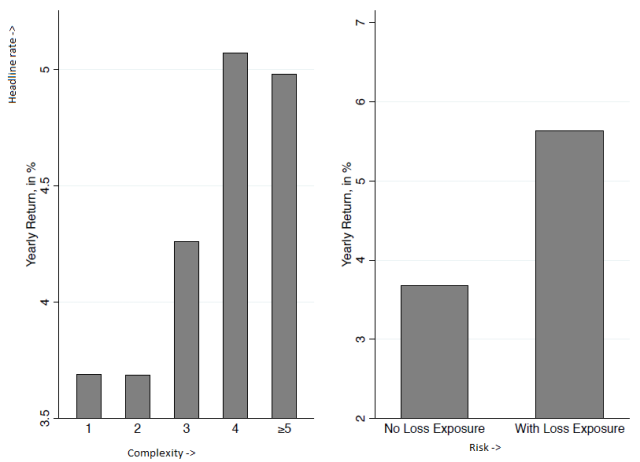
Headline rate:  the annual return the investor gets in the best scenario. So: yearly return in best possible scenario. (Note: “no significant relationship between the headline rate and ex post performance, which suggests that the best scenario did not materialize frequently.”)

Three measures of complexity (note: “text descriptions not affected by changes in disclosure requirements, such as back testing and warnings”):

  • Number of features: count the number of features in the final payoff formula of each product
  • Length of the text description: count the number of characters
  • Number of scenarios: count the number of “if” and “when” in the text description

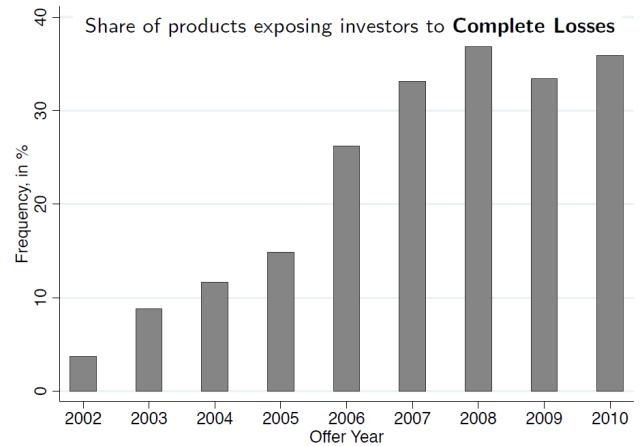
Risk: the structured product does (1) or does not (0) expose investors to complete loss of their investments.

Three Trends

[1] Headline rates depart from the level of interest rates when interest rates decrease. Relatively higher headline rates as interest rates decrease. The spread between product headline rates and interest rates increases when interest rates are low.

a decrease of 1% in the benchmark interest rate corresponds to a deviation of 0.64% of the headline rate from this interest rate. Banks offset two-thirds of the decrease in interest rates in the headline rates.

[2] Product complexity increases significantly, with no discernible drop during the global financial crisis.celerier2

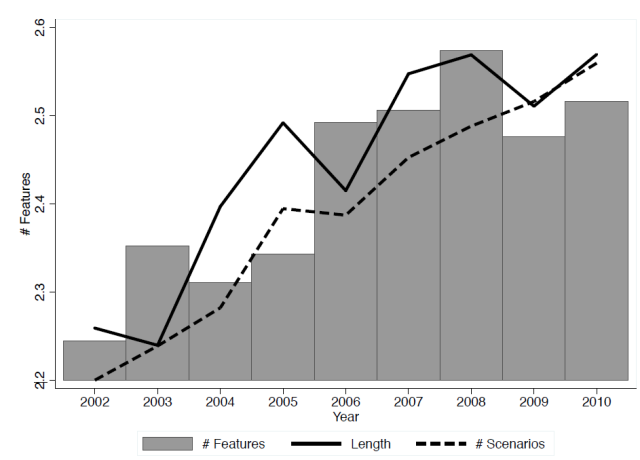
[3] The fraction of products exposing investors to complete losses increases significantly. The share of risky products increases over our sample period.

celerier3

Products offering high headline rates are both riskier & more complex

celerier4

Markups & performance

“Both products offering high headline rate and more complex products yield higher markups to the banks that issue them. These ex ante higher markups translate into lower ex post performance for more complex products”

the average estimated yearly markup [based on N=141 Euro50 products] in our sample is 0.76%. Including disclosed entry and management fees: 1.4%.

Adding one additional feature in a payoff formula translates into an increase in the yearly markup of 0.34 percentage points

Adding one additional scenario increases yearly markup by 0.2 percentage points.

Adding 100 characters to the length of the description increases yearly markup by 0.13 percentage points.

In addition, products exposing investors to complete losses appear more profitable. Products that expose investors to complete losses offer a significantly larger markup: 0.78 percentage points per year.

negative correlation between product complexity and performance. Adding one payoff feature reduces the yearly return by 0.58 percentage points.

Risk-sharing or Catering?

Results consistent with banks catering to yield seeking investors through complexity (and shrouding):

celerier1

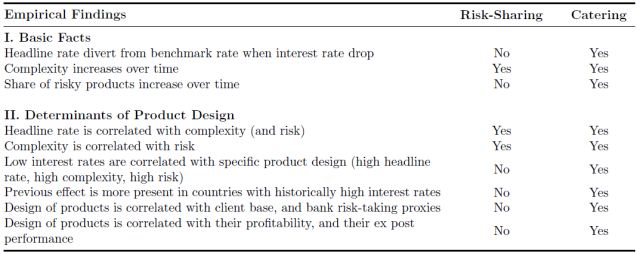
Our results support the view that banks design complex products to cater for yield-seeking investors. Our findings raise questions about the adequate regulation of complex instruments and investor protection in retail finance.

How Behavior Spreads: The Science of Complex Contagions – Damon Centola

Nice book by Damon Centola [Google Scholar] that summarizes a bunch of his papers in an accessible way. Each chapter is pretty much a paper. True to practice what you preach, there is quite some redundancy in the book, which makes it easy to pick up again if some parts are too hard to follow.

And the whole book is clear and consistent on the main message: weak ties are good for contagion, but clustered networks with wide bridges work better to achieve and maintain complex behaviors.

More info & background video’s, and the Goodreads-page.

Part I Theory

Chapter 1: Introduction can be read in full.

Chapter 2: Granovetter, strength of weak ties hypothesis + Watts & Strogatz small worlds model:  bridge ties—that is, social links connecting otherwise distant people—can dramatically increase the rate of diffusion across social networks.

Chapter 3:  Difference between “simple” informational and viral contagions, for which transmission only requires contact with a single source, and “complex” behavioral contagions, for which transmission requires contact with multiple adopters. Threshold can be absolute (e.g. >2 contacts) or relative (e.g. >25% of connections). Which type of threshold it is, affects how fast something spreads.

p38 There are at least four social mechanisms that explain why a complex contagion might require exposure to multiple sources of activation:

  1. strategic complementary (one phone is useless, value increases with adoption)
  2. credibility (more people who adopt behavior the more believable)
  3. legitimacy
  4. emotional contagion

p62 In sum: regardless of whether long ties are added to a network or rewired, whether decisions are probabilistic or deterministic, or whether ties have relational strength increasing the fraction of long ties in a network can prevent complex contagions from spreading. The structural advantage of clustered networks for diffusion is that they not only create more reinforcing support for a new behavior, they also protect a new behavior from premature exposure to countervailing influences that are likely to slow down its adoption.

Chapter 4 based on Centola, Damon. “The spread of behavior in an online social network experiment.” Science 329.5996 (2010): 1194-1197.

Overall adoption in the clustered networks (54%) was significantly higher than random networks (38%), so clustered networks improved the reach of the diffusion process/spread of behavior.

Clustered structure has more redundancy (wide bridges). Random network (weak ties, small worlds) has more exposure (contagion) but less adoption than clustered network. Also: adoption maintained longer in clustered network (long term effect).

The use of the health forum worked because of social reinforcement through credibility and complementary. Also: no saturation, each additional invitation added to diffusion/helped.

centolaCh4graphs


Part II Applications

Chapter 5: Complex contagions in other contexts, such as Twitter, Second Life or Facebook.

Chapter 6: Diffusing innovations that face opposition: clustering the early adopters together can increase the spread of innovation. So use clustered seeding/wide bridges for complex diffusion.

Chapter 7: Structural holes (gaps between meta-populations/ “islands”) can be bridged by brokerage ties (which are weak ties). Works well for contagion (simple) but not for complex adaptation such as behavior change.

Focused (clustered) vs Expansive (random connections).

Some bits in this chapter are based on Centola, Damon. “The social origins of networks and diffusion.” American Journal of Sociology 120.5 (2015): 1295-1338.


Part III Social Design

p138: The easier it is to collect network data with a small-world structure, the more prevalent these observations will become and the greater the consensus will be about the value of weak ties for diffusion. (…)

While simple contagions may be conspicuously better spreaders, they typically are not very effective for changing behaviors or transmitting new ideas that will improve the common welfare.

Chapter 8 based on Centola, Damon, and Arnout van de Rijt. “Choosing your network: Social preferences in an online health community.” Social science & medicine 125 (2015): 19-31.

p152: Homophilously (i.e. like with like, based on e.g. gender, age, BMI) designed networks significantly increased the uptake of the dieting tool, producing a 200% increase in overall adoption. [NB: number of connections stay the same]

centolach8

p153: Findings on choice architecture have shown that the choices that people make can be altered simply by controlling the way that the options are presented to them. (…) Similarly, the results here suggest that by changing the social context in which people make decisions, their choices may be altered (…) Increased uptake did not require that the technology be reengineered, only that the social networks be structured to create the right kind of social relevance.

Chapter 9 based on Zhang, Jingwen, et al. “Support or competition? How online social networks increase physical activity: A randomized controlled trial.” Preventive medicine reports 4 (2016): 453-458.

RCT with 2×2 design, individual vs group rewards, and with or without feedback on performance of others/other groups. Control = individual rewards, no feedback. Social support is group rewards without feedback. Comparison groups = comparison.

centolach9

Part IV Conclusions

p175 (chapter 3) Hubs can unintentionally block the spread of innovations because hubs have so many contacts that countervailing signals from non-adaptors can prevent highly connected individuals from adopting novel behaviors.

reinforcement and relevance are key factors for any solution.

experimental sociology

The Dark (Patterns) Side of UX Design

Ungated full paper.

evil-nudges

I wrote a blogpost in Dutch about it for the AFM website [Oct 2018]: Verleiding of misleiding? Evil nudges online

Also relevant:

Actual and perceived behaviour of personal current account customers

The Competition and Markets Authority (CMA) in the UK did a comprehensive Retail banking market investigation in 2015/2016.

A talk at RBFC by the FCA mentioned work on administrative data coupled with survey results; Actual and perceived behaviour of personal current account customers. And thanks to Paul Adams, I got to read it:

The following analysis is based on a data set of 2,938 PCA [personal current account] customers (full sample), which contains information on their actual account usage provided by banks (transaction data) and their responses to a GfK survey (survey data) which we use to assess how they perceive their account usage

Main conclusion:

Significant differences between customers’ perceptions of their account usage  and their actual behaviour (…)

  1. gives some indication that customers may not engage with or may not understand their bank account usage (…) may also indicate that customers find the pricing complex, opaque or otherwise difficult to understand.
  2. [customers] may have difficulties shopping around and identifying the best offer for their needs. This could lead to them exercising little pressure on banks to improve their current product offer.
  3. if customers underestimate their usage, they might incur costs inadvertently

Overdraft usage

In 2014, slightly less than half (44%) of PCA customers used overdrafts.

39% of overdraft users responded that they do not use an overdraft while they actually do.

Overdraft users more often underestimate than overestimate their usage.

28% are overdrawn in every month of the year. However, only 11% of those customers who actually went into overdraft in the past 12 months say that they are overdrawn in every month.

A customer-by-customer comparison reveals (Figure 3) that only 14% of customers are correct when answering how many months they are overdrawn.

CMAoverdraft

Overdraft limits

89% of all customers, and 91% of those who use overdrafts, know whether or not they have an arranged overdraft limit.

Half of customers not aware that they use an unarranged overdraft [=more expensive].

Overdraft charges

Customers broadly estimate their charges correctly.

Interest/revenue on balance

We find that 23% of customers actually receive interest and/or cashback payments on their credit balances.

With respect to credit balances we find that 60% (19% yes/yes + 41% no/no, see table) correctly know whether or not they receive any revenue on their balances, and over one third falsely think that they receive revenue while they do not.

CMAoverdraft2

Receive interest? Actual
yes no
Perceived yes 19 36
no 4 41


Wie schrijft in Tijdschrift voor Toezicht?

Sinds de oprichting in 2010 zijn er 261 bijdragen geplaatst in het Tijdschrift voor Toezicht. De herkomst van de 423 auteurs (257 unieke auteurs) heb ik geclassificeerd.

Driekwart van de bijdragen [74%] aan het Tijdschrift voor Toezicht is (deels) afkomstig uit de wetenschap, ruim een derde [36%](deels) uit toezicht. De brug tussen toezicht en wetenschap die het Tijdschrift van Toezicht wil slaan, komt het best tot uiting in het kwart van de bijdragen met inbreng uit beide disciplines.

vennALLmetcijfers2

Ik heb uitgezocht of het Tijdschrift voor Toezicht een tijdschrift door toezicht(houders) is, of meer een tijdschrift over toezicht door wetenschappers. Zijn schrijvers van stukken voor dit blad verbonden aan een universiteit of een toezichthoudende organisatie (of beide)?

Zo profileert het blad zichzelf:

Tijdschrift voor Toezicht is een wetenschappelijk tijdschrift van, voor en door experts die zich beroepshalve bezighouden met het onderwerp toezicht in al zijn facetten. Het wil een brug slaan tussen wetenschap en praktijk en faciliteert dat uiteenlopende disciplines van elkaar kunnen leren.

Data

Voor het maken van de database heb ik gegevens uit alle beschikbare inhoudsopgaves verzameld. Alle data heb ik op 2 oktober 2018 van de website gehaald, toen editie 2-3 van 2018 verscheen. Het hele databestand inclusief categorisaties is beschikbaar op mijn website wilte.nl/TvTauteurs.xlsx.

Sinds de start in 2010 verschijnen er ieder jaar vier edities van het Tijdschrift voor Toezicht. In 2017 en 2018 waren er gecombineerde edities, waardoor het totale databestand 33 edities beslaat.

Classificatie auteurs

Handmatig heb ik alle auteur/artikel-combinaties ingedeeld in “wetenschap” en/of “toezicht”. Universiteiten en hogelscholen schaar ik onder wetenschap. Auteurs met (emeritus) prof. als titel deelde ik automatisch in bij “wetenschap”. De Belastingdienst, een rekenkamer, en het Functioneel Parket van het Openbaar Ministerie heb ik bij toezicht ingedeeld. Het Wetenschappelijk Onderzoek- en Documentatiecentrum (WODC), de Sociaal-Economische Raad (SER), de Wetenschappelijke Raad voor het Regeringsbeleid (WRR) en verschillende advocatenkantoren vallen in mijn indeling onder geen van beide.

Bij de classificatie van wetenschap en/of toezicht baseerde ik me op de auteursomschrijving bij het betreffende artikel. Deze methodologie leidt er toe dat sommige veelschrijvers soms wel en soms niet in de categorie ”toezicht” komen. Bij een artikel uit nummer 3 van 2017 staat Paul Robben alleen omschreven als “hoogleraar iBMG, Erasmus Universiteit”, terwijl bij de 11 andere artikelen van Robben wel ook de Inspectie voor de Gezondheidszorg genoemd wordt.

Een ander voorbeeld: de auteur met de meeste artikelen (15) in het Tijdschrift voor Toezicht is Margot Aelen. Zes daarvan schreef ze voor haar promotie, acht erna. Als promovenda schreef ze zeven artikelen (= categorie wetenschap), als medewerker van De Nederlandsche Bank schreef ze er negen (=categorie toezicht). Eén van de 15 artikelen schreef Aelen dus vanuit zowel de wetenschaps- als de toezichtscategorie. Bij 11 van haar 15 artikelen was ze ook redactielid van het Tijdschrift voor Toezicht.

Soort artikel

In 2016 werden bepaalde soorten artikelen onder kopje Diversen geschaard, die heb ik weer als Notenkraker of Diverse geherclassificeerd. Ook Diversen: Verslag werd Diversen. Vanaf 2018 bestaat ook de categorie “peer-reviews artikel”, terwijl artikelen daarvoor (ook peer-reviewede) artikel heetten. Daar heb ik ook een categorie van gemaakt.

257 unieke auteurs

De database bevat 33 edities. In de database staan 423 rijen. Iedere rij is een combinatie van artikel en auteur. Een artikel met drie auteurs is dus goed voor drie rijen in de database. Sinds de oprichting zijn er 261 artikelen gepubliceerd, door 257 unieke auteurs. Bij vier artikelen is er geen auteur vermeld. Dat dit ook tot 261 optelt, is toeval.

Van alle unieke auteurs, heeft 77% (N=198) één keer een bijdrage geleverd, 35 auteurs (14%) waren goed voor twee stukken en 25 schrijvers waren drie of meer keer (mede-)auteur in dit blad.

Van alle bijdragen is 59% geschreven door één auteur, en 28% door twee auteurs. Het maximaal aantal auteurs van een stuk in Tijdschrift voor Toezicht is vijf, dat kwam zes keer voor (2% van totaal). De 15 bijdragen met vier of meer auteurs zijn vrijwel altijd een artikel of casus. De 78 verschenen artikelen zijn gemiddeld door twee auteurs geschreven, meer dan 90% van de columns (N=27) en jurisprudenties (N=24) zijn door één auteur geschreven. Gemiddeld zijn er 1,6 auteurs per bijdrage.

Van de 423 unieke auteur/artikel-combinaties zijn er 151 (36%) door een hoogleraar geschreven, 230 (54%) door een gepromoveerde auteur en 150 (35%) door een auteur met een juridische titel als mr. of LL.M. Een meerderheid van de bijdragen wordt dus geleverd door auteurs met een proefschrift op hun naam. Ruim een derde van de auteur/artikel-combinaties heeft een juridische achtergrond.

De redactieleden van het Tijdschrift voor Toezicht waren betrokken bij 72 van de 423 auteur/artikel-combinaties (17%) en bij een kwart van de 261 artikelen. Opvallend genoeg lijkt, afgaand op de auteursomschrijving, 30% van de rubriek redactioneel niet geschreven door een redactielid van het Tijdschrift voor Toezicht. Dertien bijdragen zijn “open access”.

Een derde stukken vanuit toezichthouder

In de Tabel staat voor de verschillende soorten bijdragen die het Tijdschrift voor Toezicht kent, in hoeverre de auteur of auteurs binnen de wetenschap en/of een toezichthouder werkzaam zijn. Per artikel kan dit ja (1) of nee (0) zijn. De percentages in de tabel zijn het gemiddelde hiervan. Een stuk met vijf auteurs waarvan er één (ook) bij een toezichthouder werkt, scoort al een “ja” (1) voor bijdrage vanuit toezicht.

Van alle bijdragen, is een kwart met inbreng vanuit zowel wetenschap als toezicht. Nota bene: dat kan ook in één persoon verenigd zijn. Bij driekwart (74%) van de bijdrages is er een inbreng vanuit de wetenschap, voor ruim een derde (36%) van de artikelen was er inbreng vanuit een toezichthouder.


Met een bijdrage vanuit…

Soort bijdrage Aantal Wetenschap Toezicht Zowel toezicht als wetenschap Redactie Tijdschrift voor Toezicht
Artikel 78 82% 37% 31% 14%
Diversen 43 67% 30% 12% 19%
Redactioneel 33 73% 45% 30% 70%
Column 27 70% 33% 26% 15%
Jurisprudentie 24 50% 13% 8% 50%
Discussie 22 82% 50% 36% 23%
Boekbespreking 13 85% 31% 23% 0%
Praktijk 8 88% 63% 50% 13%
Uit het veld 4 50% 75% 25% 0%
Casus 3 33% 100% 33% 33%
Notenkraker 3 100% 0% 0% 0%
Essay 2 50% 0% 0% 0%
Opinie 1 100% 0% 0% 0%
Totaal 261 74% 36% 25% 25%

De Figuur hieronder bevat dezelfde indeling als de tabel, alleen zijn hier de artikelen per jaargang op de horizontale as geplaatst. De balken per jaar lopen tot 100%. Per groep is het absolute aantal artikelen weergegeven. Over de tijd lijkt er geen patroon in meer of minder bijdragen vanuit toezicht of wetenschap. Merk op dat jaargang 2017 maar uit drie nummers bestaat en jaargang 2018 in deze dataset uit twee nummers.

Figuur1_herkomstperjaargang

De figuur met de twee overlappende cirkels aan begin van deze post, geeft op een andere manier de verdeling weer tussen wetenschap en toezicht in artikelen van het Tijdschrift voor Toezicht. Als check, heb ik ook naar een deelverzameling van de bijdragen (N=118) gekeken. Daarbij gaat het om bijdragen in de vorm van een artikel, casus, essay, opinie of praktijk-stuk. Ook voor deze bijdragen is de verhouding vergelijkbaar; bij ruim driekwart (79%) van deze bijdragen is er een inbreng vanuit de wetenschap en 43% kent inbreng vanuit een toezichthouder.

Mijn classificatie voor de categorie “wetenschap” is misschien wat streng. Instituten met “wetenschappelijk” in hun naam zoals WRR en WODC, heb ik niet in die categorie geplaatst. Een lossere indeling zal geen effect hebben op aandeel met herkomst toezicht, maar zal tot een verschuiving van “geen van beiden” (nu 39 bijdragen, 15% van totaal) naar “wetenschap”. Waardoor het aandeel bijdragen aan het Tijdschrift voor Toezicht vanuit de wetenschappelijke hoek nog hoger dan de huidige driekwart wordt.

Conclusie

Ruim een op de drie artikelen bevat een bijdrage vanuit een toezichthouder, driekwart vanuit de wetenschap. De overlap tussen toezicht en wetenschap (al dan niet in dezelfde persoon) is ook substantieel. Deze verhoudingen zijn redelijk consistent sinds de oprichting van het Tijdschrift van Toezicht in 2010.

Het blad is primair een wetenschappelijk tijdschrift en dat blijkt ook uit de schrijvers, die voornamelijk uit de wetenschappelijke hoek komen. Bijdragen alleen vanuit de toezichtshoek zijn schaars, bij ruim twee derde (65 van de 90 bijdragen) met inbreng vanuit toezicht, was ook een wetenschapper betrokken. Dat kan je ook positief opvatten; de brug is geslagen tussen wetenschap en praktijk, zoals het Tijdschrift voor Toezicht beoogt.

Why Do Investors Hold Socially Responsible Mutual Funds?

Why Do Investors Hold Socially Responsible Mutual Funds? Arno Riedl & Paul Smeets (2017) Journal of Finance [internet appendix]

Abstract

To understand why investors hold socially responsible mutual funds, we link administrative data to survey responses and behavior in incentivized experiments. We find that both social preferences and social signaling explain socially responsible investment (SRI) decisions. Financial motives play less of a role. Socially responsible investors in our sample expect to earn lower returns on SRI funds than on conventional funds and pay higher management fees. This suggests that investors are willing to forgo financial performance in order to invest in accordance with their social preferences.

16.2% of the investors in the sample can be classified as socially responsible investors, because they hold at least one SRI equity fund.

  • Risk perceptions are unrelated to holdings of SRI funds
  • socially responsible investors have a longer investment horizon.
  • Individual socio-economic characteristics only play a marginal role in determining whether or not investors hold SRI equity funds
  • socially responsible investors have a slightly more positive view on the performance of SRI equity funds than conventional investors

Overall, we identify a number of reasons why individuals decide to invest in a socially responsible manner. Our most robust and strongest result is that intrinsic social preferences play a dominant role, even when controlling for other possible explanatory variables such as risk preferences, trading activity, realized Sharpe ratios and other investor characteristics.

This suggests that strong social preferences are needed to take the hurdle to buy an SRI fund in the first place, but social preferences are less important for deciding on the fraction of the portfolio held in SRI funds

The average yearly total expense ratio (TER) of socially responsible equity funds is with 2.2% significantly higher than the 1.5% fees paid on conventional equity funds (p=0.023). These extra fees are used to screen portfolios on environmental and social criteria.

Conclusion

In this paper we investigate why individuals hold socially responsible equity funds.

  1. We find that investors’ intrinsic social preferences are a major factor determining the likelihood to hold SRI equity funds.[return more money as second mover in trust game]
  2. In addition, we find evidence for social signaling also being important in socially responsible investment decisions.[talk more about investing]
  3. Financial reasons also play a role in the decision to invest in a socially responsible manner.
    • Investors who expect that SRI equity funds underperform relative to conventional equity funds are less likely to invest in a socially responsible manner.
    • We also find that most socially responsible investors expect the returns on SRI funds to be lower than on conventional funds, achieve worse Sharpe ratios
    • Higher fees on SRI funds suggests that on average investors with a strong social motivation are willing to forgo financial returns in order to invest in accordance to their social preferences.

Data

We use administrative individual investor data from one of the largest mutual fund providers in the Netherlands (Robeco), covering the period June 2006 to June 2012

The administrative data provide information on 3,382 socially responsible  investors, all of whom were invited to participate in the survey (12% respons; N=406). Next to the  sociallyresponsible investors, we randomly selected 35,000 investors of the approximately 145,000 remaining accounts in the database (8% respons; N=2800).

Methods

A. Administrative Variables
A.1. SRI Equity Fund Holdings
A.2. Other Portfolio Characteristics (holding period, returns, volatility)

B. Survey Variables
B.1. Return Expectations and Risk Perceptions
B.2. Signaling ( “I often talk about investments with others.” on a 7-point Likert scale. Strong signaling is a dummy variable taking on value 1 for investors who score equal to or higher than the median )
B.3. Investment Knowledge, SRI Perception, Education Level and Other Investor
Characteristics
B.4. Donations

C. Incentivized Experiments
C.1 Risk Preferences (cf Holt & Laury)
C.2 Social Preferences (trust-game, second mover amount)

Guiso, Sapienza and Zingales (2013) for a discussion of the pros and cons of surveys for studying financial decisions)